Monitors
ReturnPod checks your URLs, endpoints, or heartbeats at a set interval. If the check fails (or a heartbeat is missed), we alert you and update your status page.
Monitor types
- HTTP/HTTPS – We request the URL. A 2xx or 3xx response is success. We measure full response time (TLS + body).
- Keyword – Same as HTTP, but we also check that the response body contains the keyword you set.
- Heartbeat – You ping us on a schedule (e.g. cron). We alert if we don't receive a ping within the expected window. No outbound request to your URL.
- TCP – We check that the given host:port accepts a TCP connection (e.g.
example.com:443).
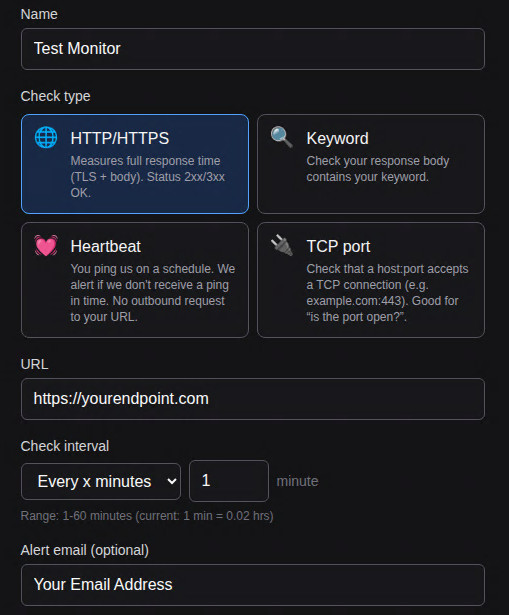
Adding a monitor
From the dashboard, click Add monitor. Choose the type, enter the URL (or host:port for TCP), set the check interval, and optionally add alert email, webhook, Slack, or Discord. Save.
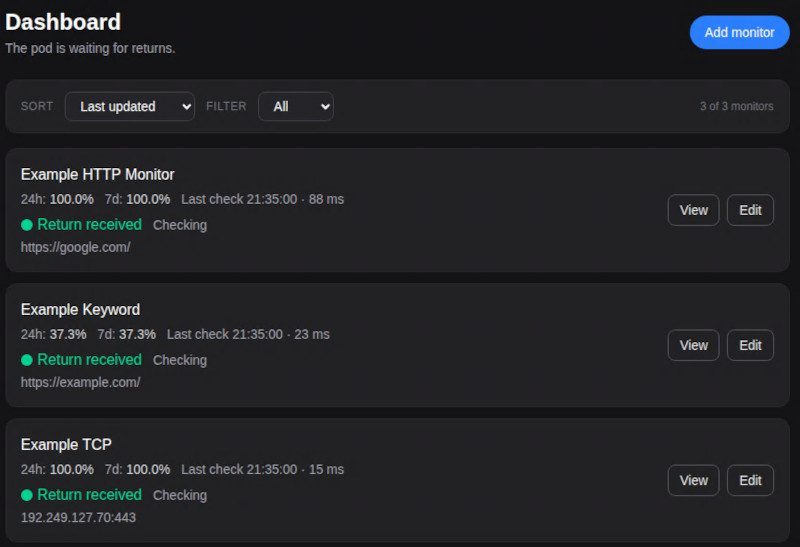
Dashboard
Your monitors appear on the dashboard with status (up/down), last check time, and quick links to view or edit.
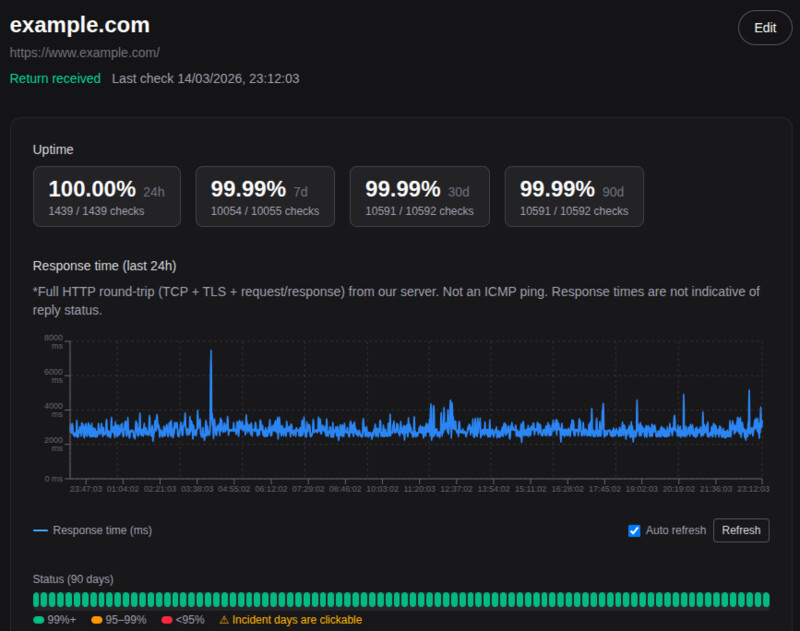
Live Monitor stats
On each monitor’s detail page you’ll see uptime over 24h, 7d, 30d, and 90d, a response time graph for the last 24 hours, and a 90-day status timeline.
Intervals
- Minimum interval is 1 minute for most plans. We run the check at that frequency (e.g. every 5 minutes).
- For heartbeats, the interval is the window in which we expect to receive a ping; if none arrives, we mark the monitor down and alert.
Pausing
You can pause a monitor from the edit screen. Paused monitors are not checked and do not send alerts. Heartbeat monitors start paused until you've configured your side to ping the URL.